


Egypt devalued its currency twice in 2015 to create a more attractive environment for foreign investors, but the weaker Egyptian pound makes goods and services more expensive for locals


| Egypt key economic indicators | |||||||||||
|---|---|---|---|---|---|---|---|---|---|---|---|
| 2010 | 2011 | 2012 | 2013 | 2014 | 2015e | 2016f | 2017f | 2018f | 2019f | 2020f | |
| Nominal GDP ($bn) | 218.8 | 235.6 | 262.3 | 271.4 | 286.4 | na | na | na | na | na | na |
| GDP per capita ($) | 2,779 | 2,930 | 3,183 | 3,205 | 3,304 | na | na | na | na | na | na |
| Real GDP growth (annual change, %) | 5.1 | 1.8 | 2.2 | 2.1 | 2.2 | 4.2* | 4.3 | 4.5 | 4.7 | 5 | 5 |
| Government revenue (% of GDP) | 25.1 | 22 | 22.1 | 23 | 25 | 23.7* | 25.5 | 26.1 | 25.9 | 25.7 | 25.9 |
| Government total expenditure (% of GDP) | 33.4 | 31.8 | 32.7 | 37.1 | 38.6 | 35.4* | 34.9 | 33.5 | 33.1 | 32.6 | 32.5 |
| General government gross debt (% of GDP) | 73.2 | 76.6 | 78.9 | 89 | 90.5 | 90.0* | 89.3 | 84.8 | 81.7 | 79.3 | 77 |
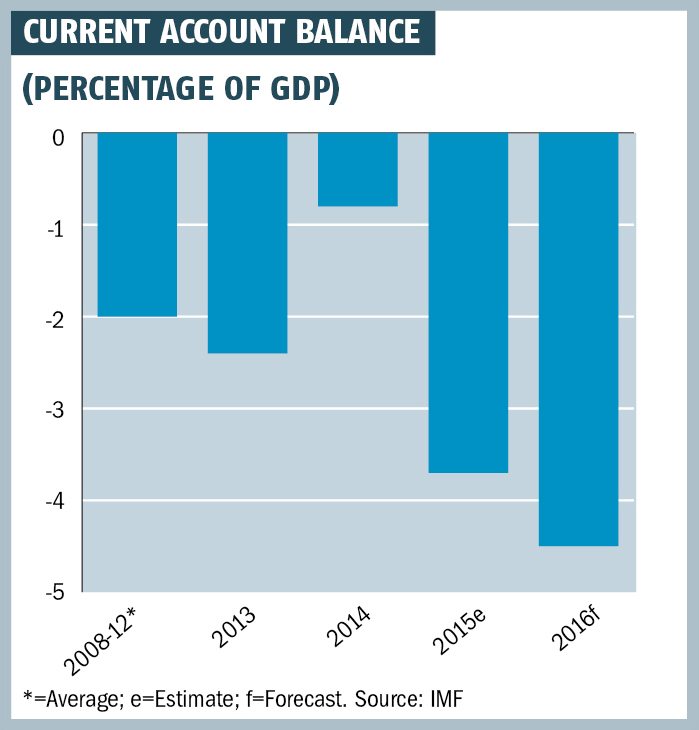
| Current account balance (% of GDP) | -2 | -2.6 | -3.9 | -2.4 | -0.8 | -3.7* | -4.5 | -4.5 | -4.5 | -4.5 | -4.2 |
| Inflation (%) | 10.6 | 11.8 | 7.3 | 9.8 | 8.2 | 11.4 | 10.4* | 10.4 | 8 | 7 | 7 |
| Population (millions) | 78.7 | 80.4 | 82.4 | 84.7 | 86.7 | 88.4* | 90.2 | 92 | 93.8 | 95.7 | 97.6 |
| Unemployment (%) | 9.2 | 10.4 | 12.4 | 13 | 13.4 | 12.9 | 12.4* | 11.7 | 10.9 | 9.8 | 8.8 |
| e=Estimate; f=Forecast; na=Not available; *=Estimates as of October 2015. Source: IMF | |||||||||||
You might also like...

Renewable power in Saudi Arabia’s water PPP market
15 July 2026

Adnoc Offshore awards Das Island tank farm contract
15 July 2026

Houthi truce collapse widens Gulf risk map
15 July 2026

Oman tenders advisory for 4GW solar programme
15 July 2026


A MEED Subscription...
Subscribe or upgrade your current MEED.com package to support your strategic planning with the MENA region’s best source of business information. Proceed to our online shop below to find out more about the features in each package.
Take advantage of our introductory offers below for new subscribers and purchase your access today! If you are an existing client, please reach out to your account manager.